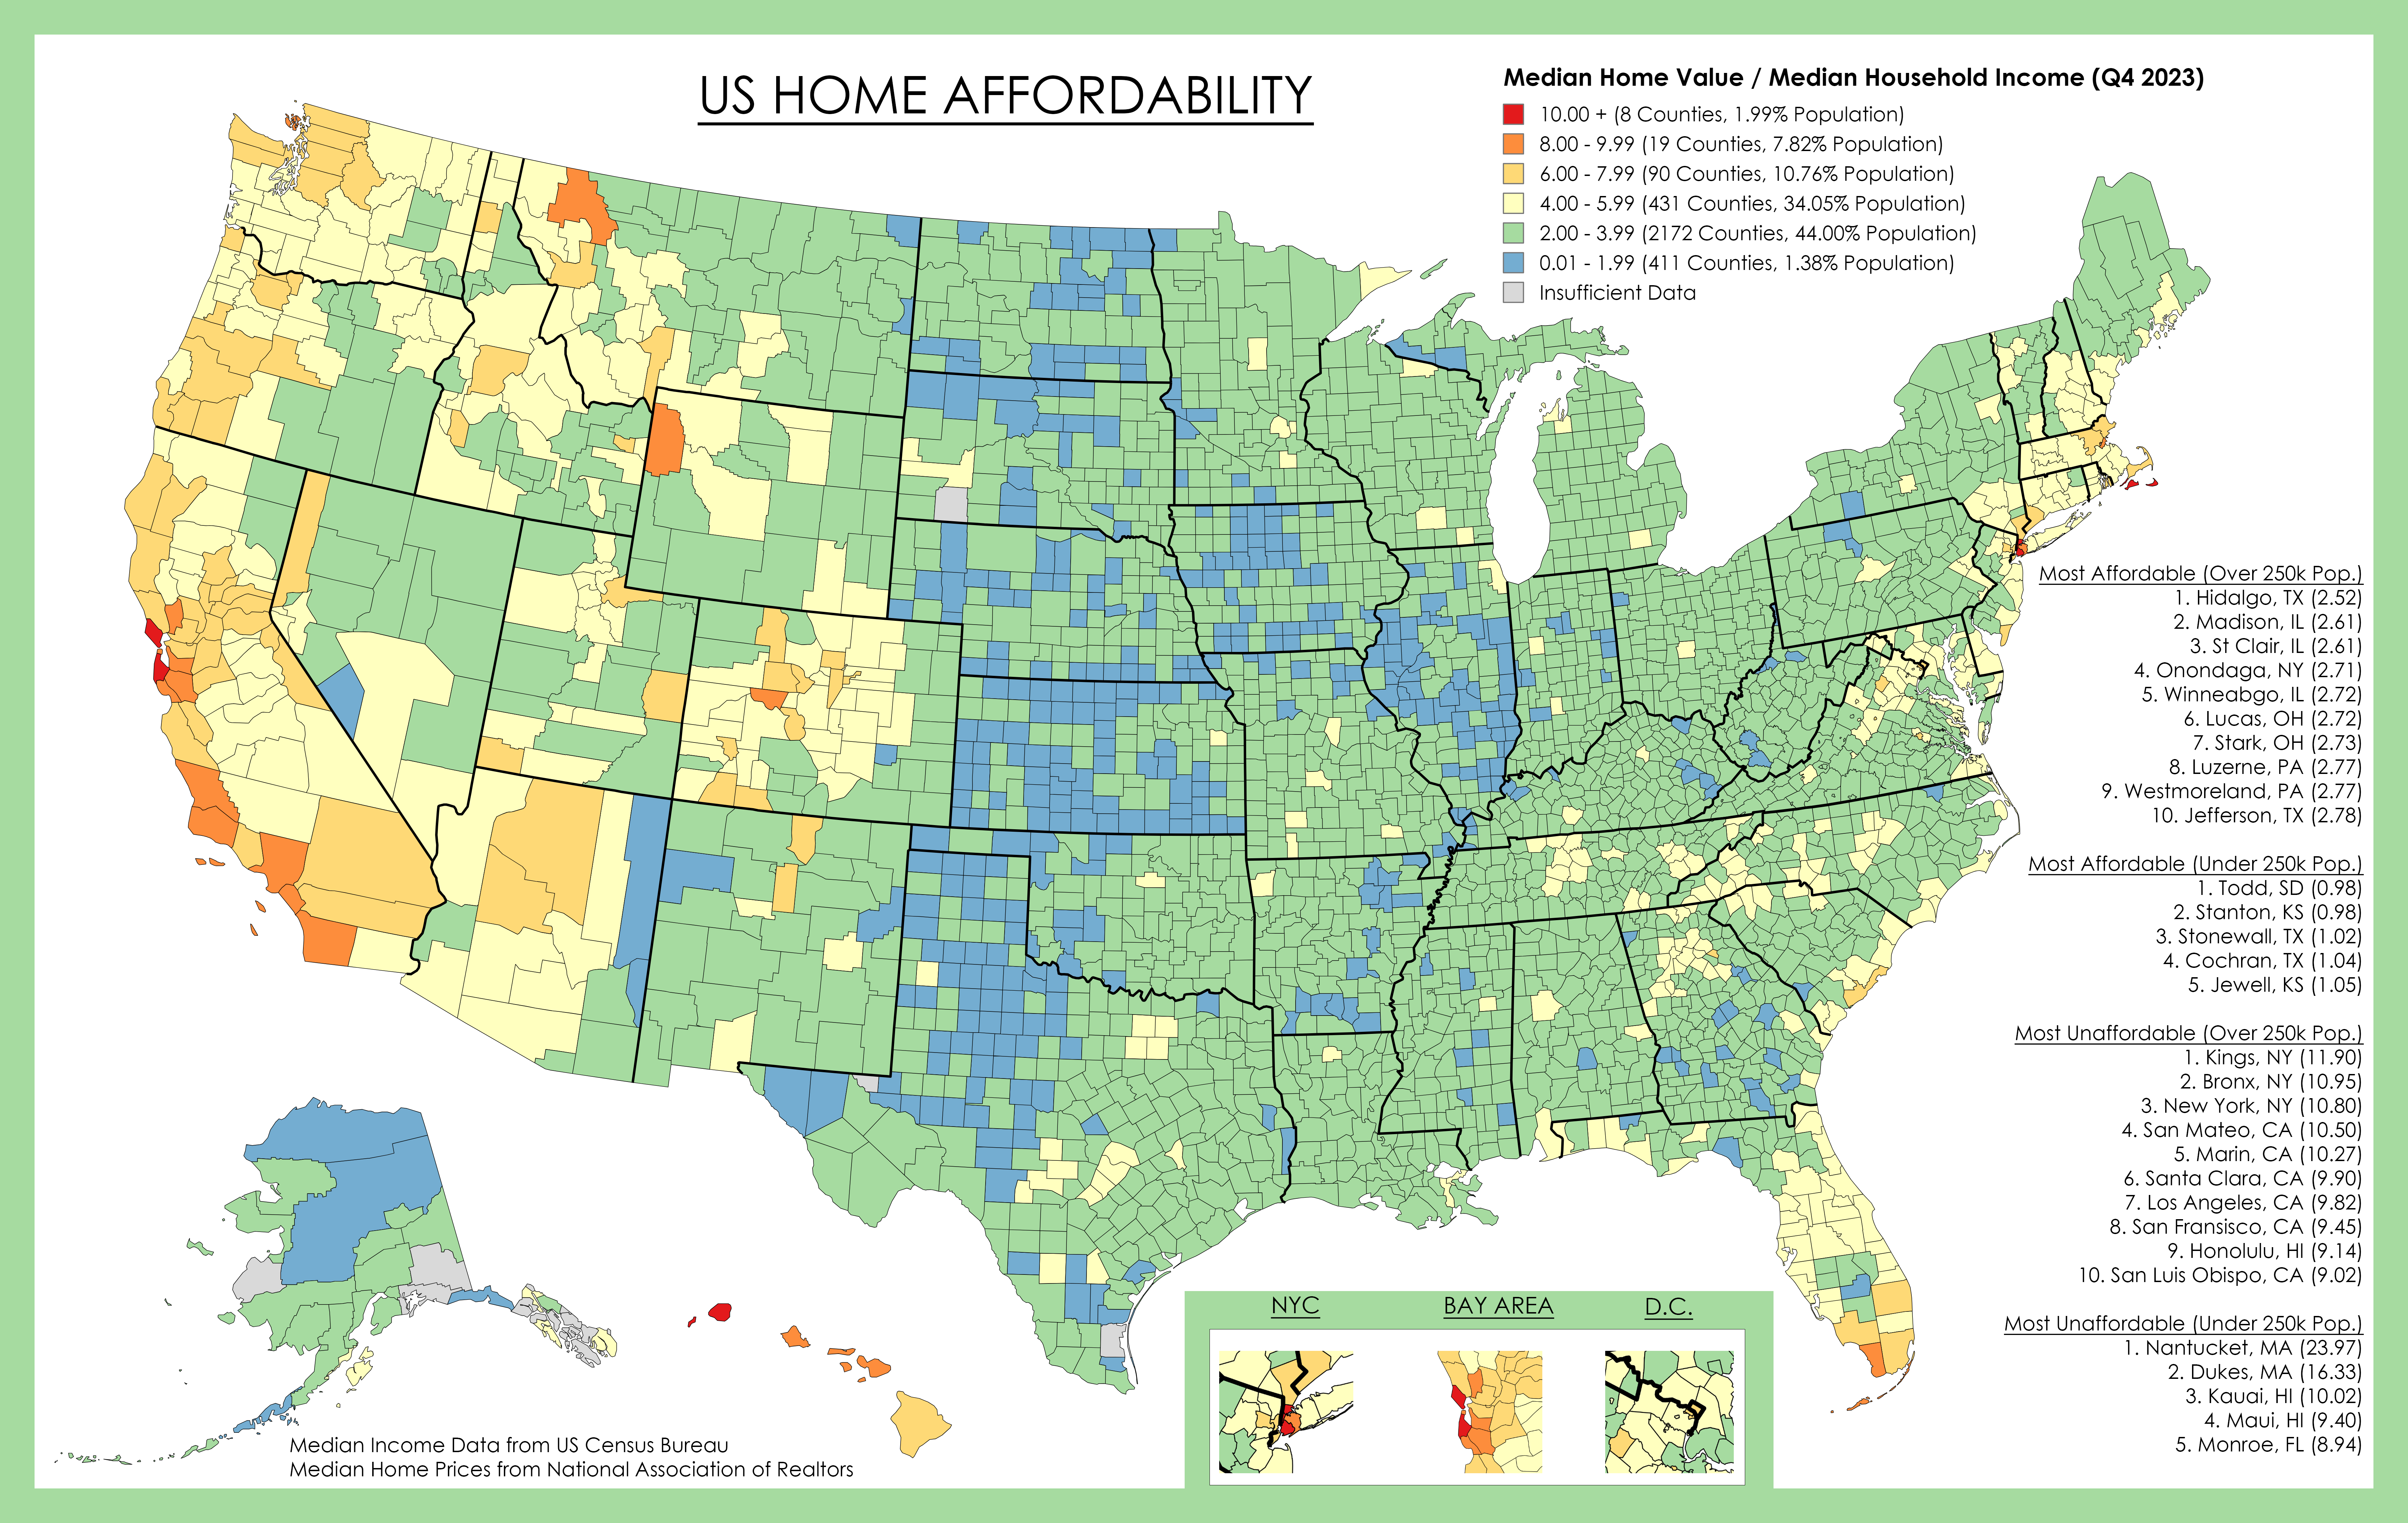
This shows county median home values divided by county median household income, both for 2023.
For example a score of "5" means the median home price in that county is 5 times the median household income in that county.
Generally, a score under 4 is considered affordable, 4-6 is pushing it, and over 6 is unaffordable for the median income.
There are of course other factors to consider such as property tax, down payment amount, assistance programs, etc. Property tax often varies at the city/township level so is impossible to accurately show.
Median Household Income Data is from US Census Bureau.
Median Home Value from National Association of Realtors, and Zillow/Redfin .
Home Values Data Link with map (missing data pulled from Zillow/Redfin/Realtor)
Probably not a whole lot different than https://xkcd.com/1138/ . Still good to see the data.
It's technically supposed to be per capita in a sense because it's a ratio of income to property values. That said, it's got it's own flaws since living situations can vary drastically from place to place (and cities skew because of population density). So ... Yeah, xkcd.