365
you are viewing a single comment's thread
view the rest of the comments
view the rest of the comments
this post was submitted on 03 Mar 2024
365 points (91.2% liked)
Climate - truthful information about climate, related activism and politics.
4484 readers
412 users here now
Discussion of climate, how it is changing, activism around that, the politics, and the energy systems change we need in order to stabilize things.
As a starting point, the burning of fossil fuels, and to a lesser extent deforestation and release of methane are responsible for the warming in recent decades:

How much each change to the atmosphere has warmed the world:

Recommended actions to cut greenhouse gas emissions in the near future:

Anti-science, inactivism, and unsupported conspiracy theories are not ok here.
founded 11 months ago
MODERATORS
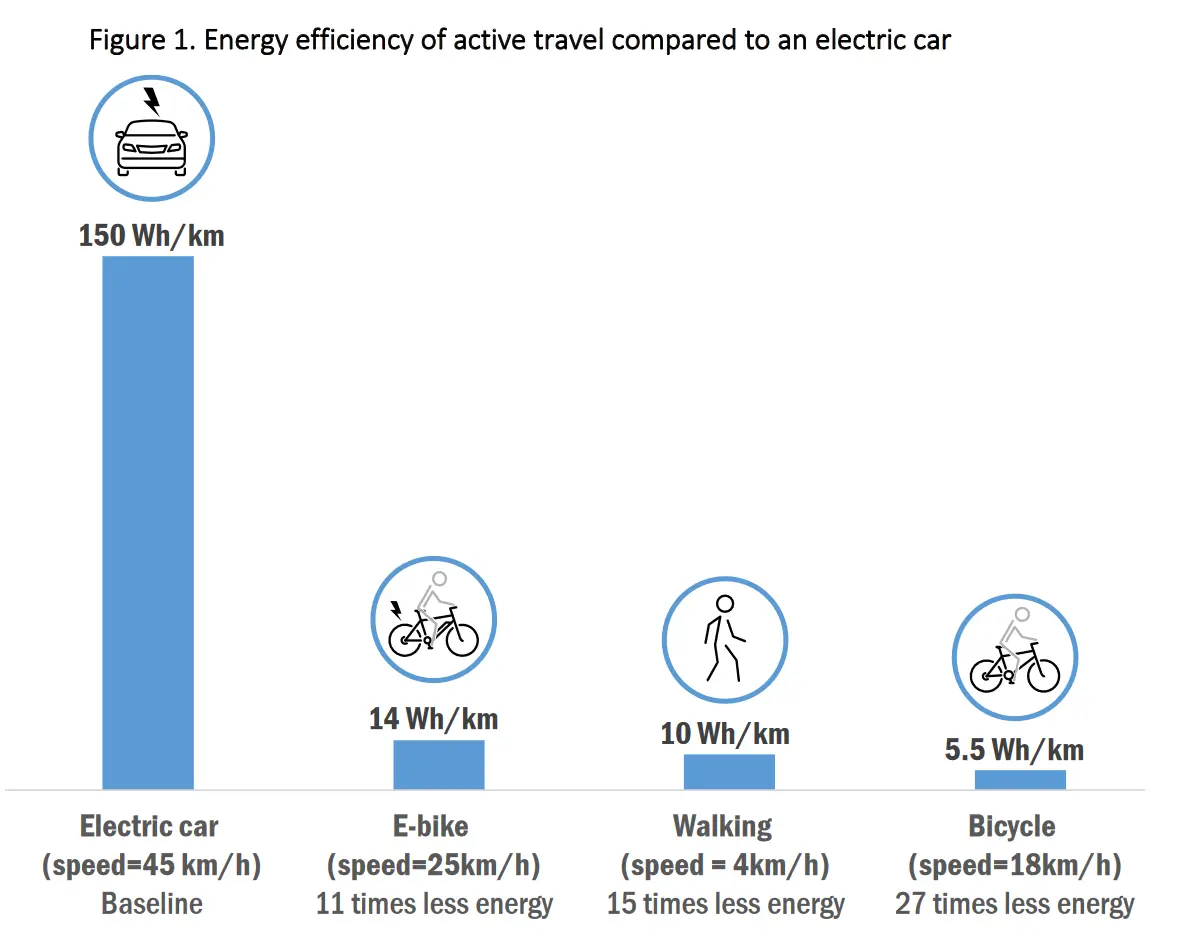
Really had to drop that car speed down to make a meaningful chart huh?
Wdym? The faster a car moves (or anything, not just a car) the less efficient it's gonna be, because it has to fight against more and more wind resistance.
They're saying that at highway speeds the cars energy usage would be off the chart, or if they scaled the chart to that usage, everything else would be too small to discern the differences.
You guys are in agreement.
Aaah, I get it now, thanks!
Is this actually an empty comment or is something wrong with my client?
It’s empty for me too, fwiw. As is the other reply to you
The measure of productivity of transportation is distance traveled, not speed (unless this were some time race). Comparing kw/speed tells you nothing about the kWh used to make the same trip as alternative modes of transportation.
In theory I agree, in practice other stuff, as the need for heating/cooling, really muddled the theory and puts the sweet spot speed way up. And if we turn the Aircon off, 150 is a really high number.
That isn't entirely true. At lower speeds there may be other inefficiencies that are worse than wind resistance (since wind resistance becomes negligible at low speeds).
It will depend on the vehicle, but for example, small gasoline cars are more efficient at ~70 km/h than at lower speeds. Electric vehicles will likely be more efficient at lower speeds (~40 km/h) than gas vehicles, due to (lack of) gearing but there will still be low speeds where they are less efficient than higher speeds.
https://www.researchgate.net/figure/ehicle-energy-economy-at-different-speeds_fig1_326822085
Besides the other comment being right about air resistance, a speed of around 40 km/h is considered safe in urban environments and artificial obstacles are now being placed to lower traffic speed to about that limit. Also, the mean speed is also around that in towns where you either go faster than the limit or go 0 in a traffic jam
What would the energy usage be if all of them were going the same speed?
More importantly, the KWH used to go the same distance. Sure a car uses more power... It's going faster, and gets to its destination faster, therefore using power for less time.
Energy is measured in KWH, people. But yeah, your point about normalizing to the same speed to make the comparison fair is good.
The graph is in Wh per Km, so it's already measuring the energy per same distance.
It's still inaccurate though. Even at (slow) highway speeds my Ioniq uses slightly less than 150wh per km, if I drove a constant speed of 45km/h I could easily hit under 80wh per km