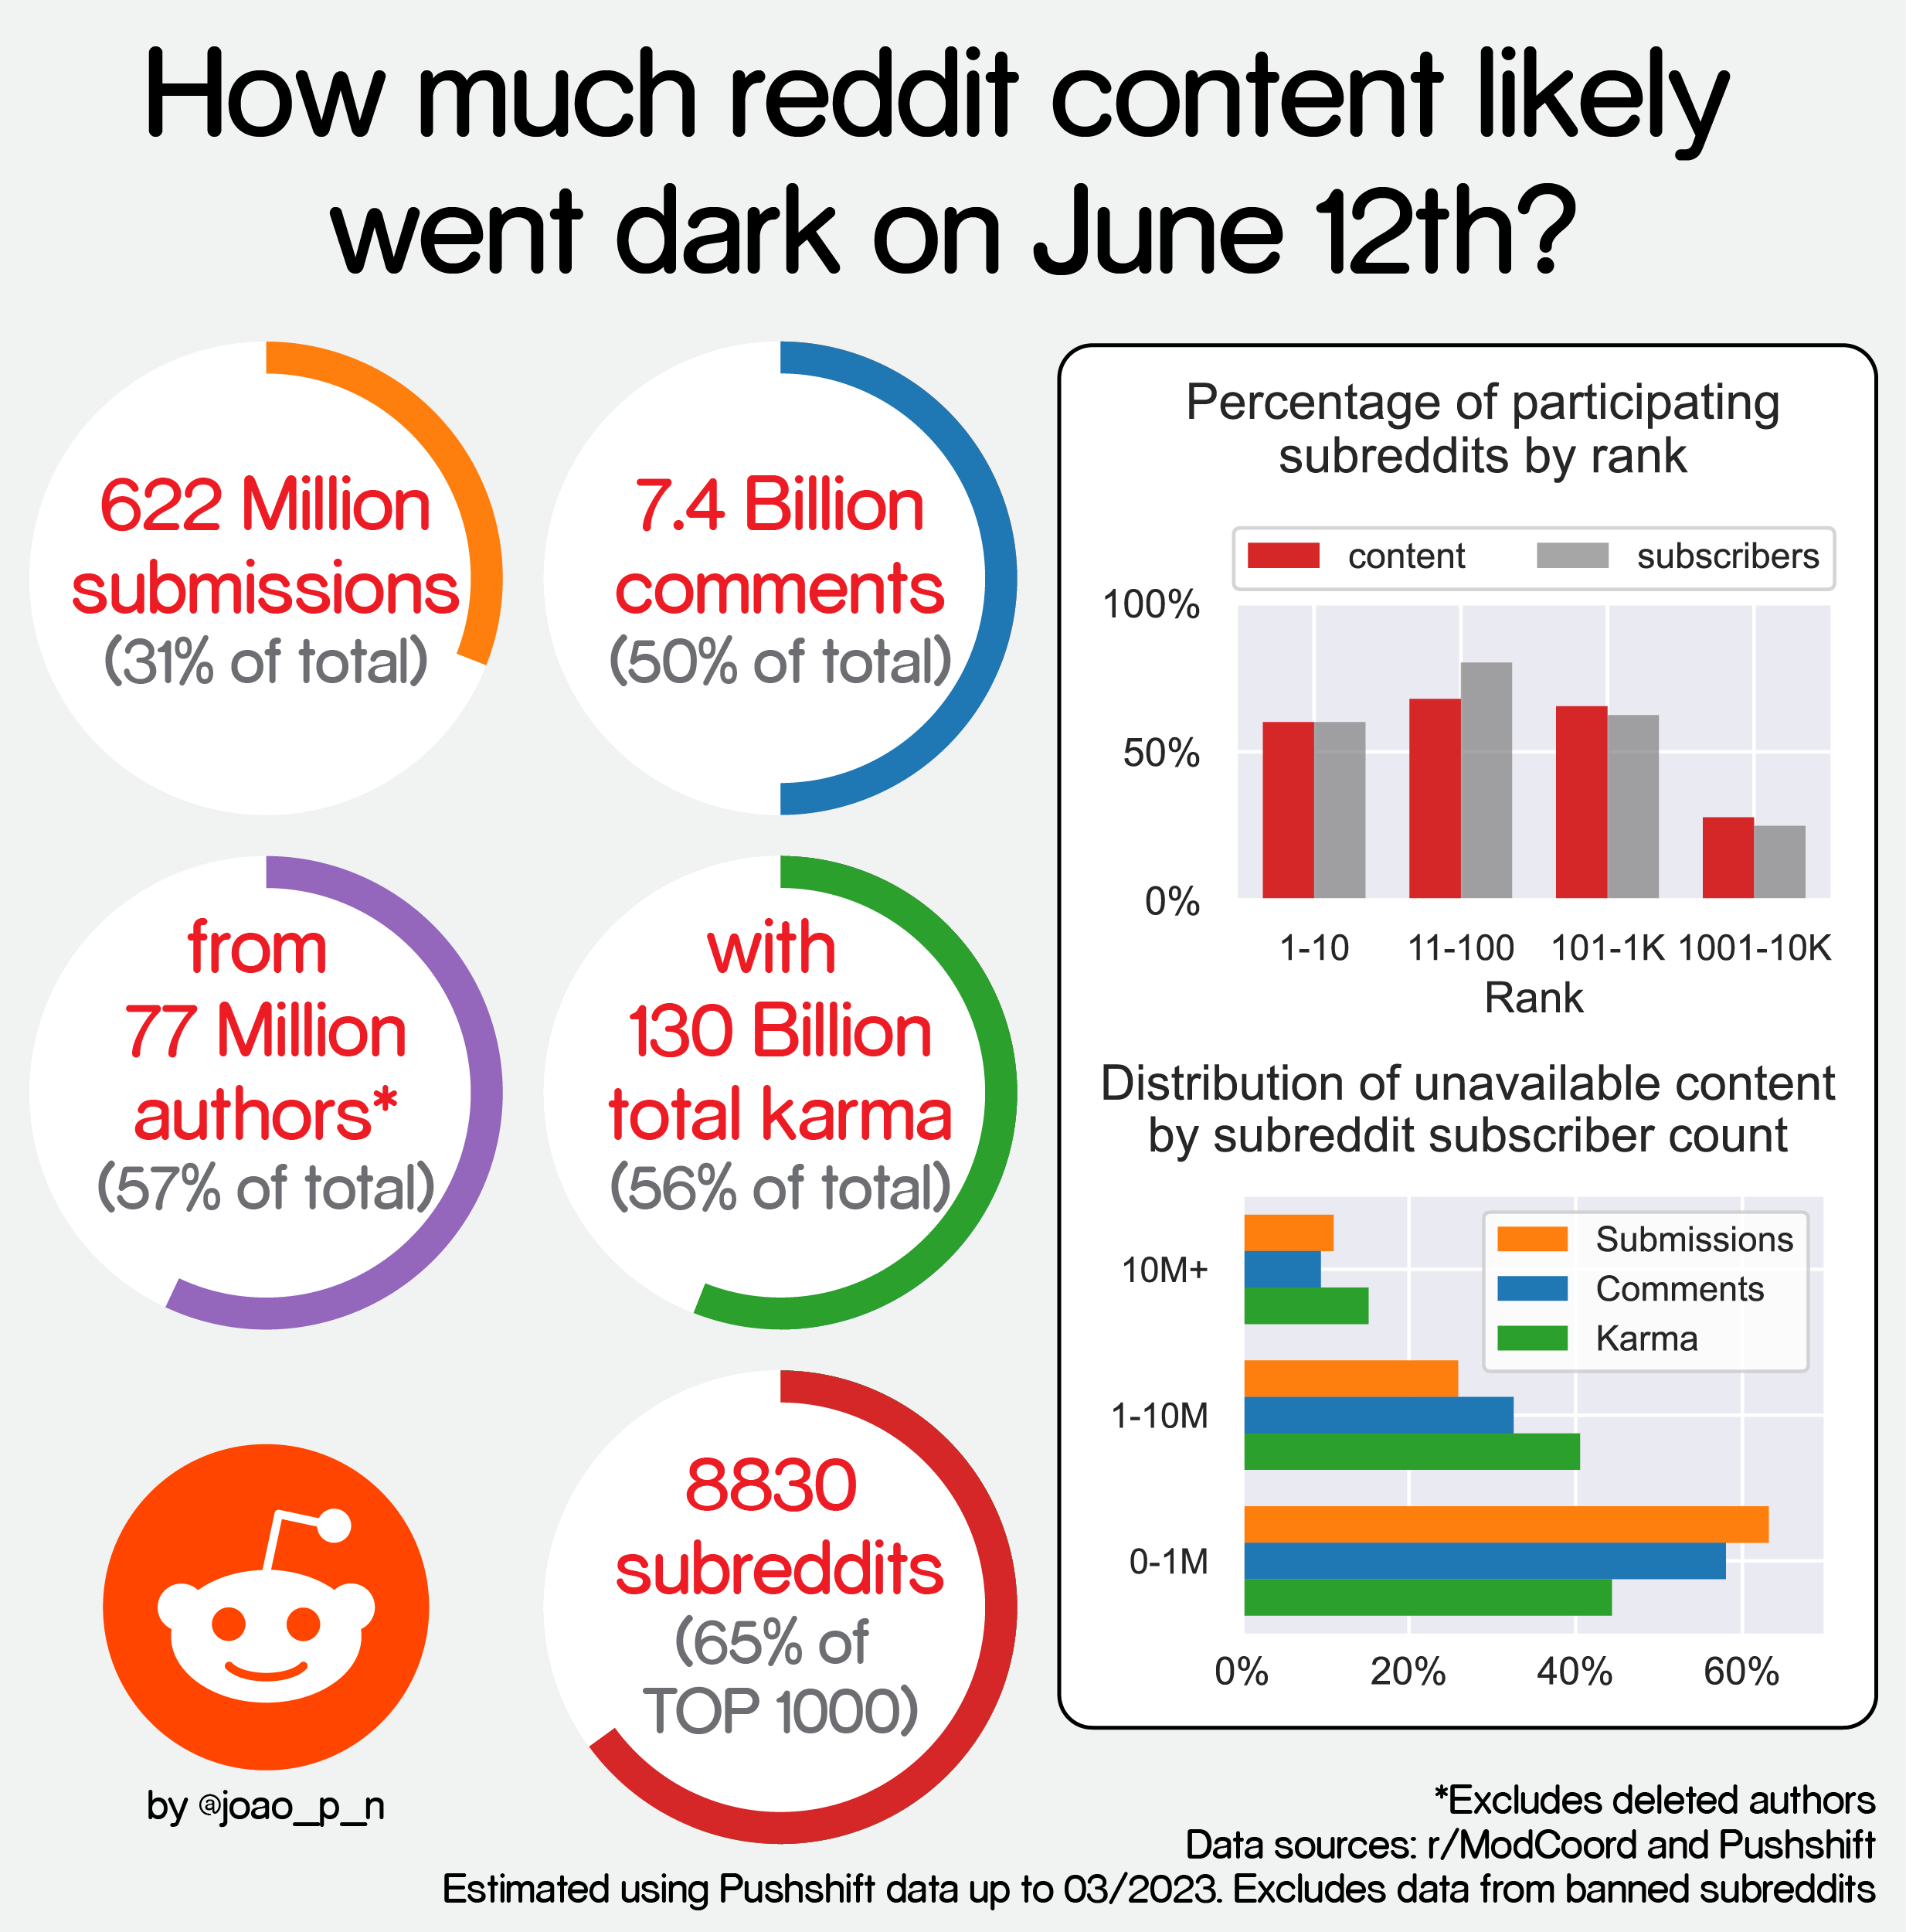
Credit: /u/joaopn on reddit
A place to share and discuss data visualizations. #dataviz
(under new moderation as of 2024-01, please let me know if there are any changes you want to see!)
Credit: /u/joaopn on reddit
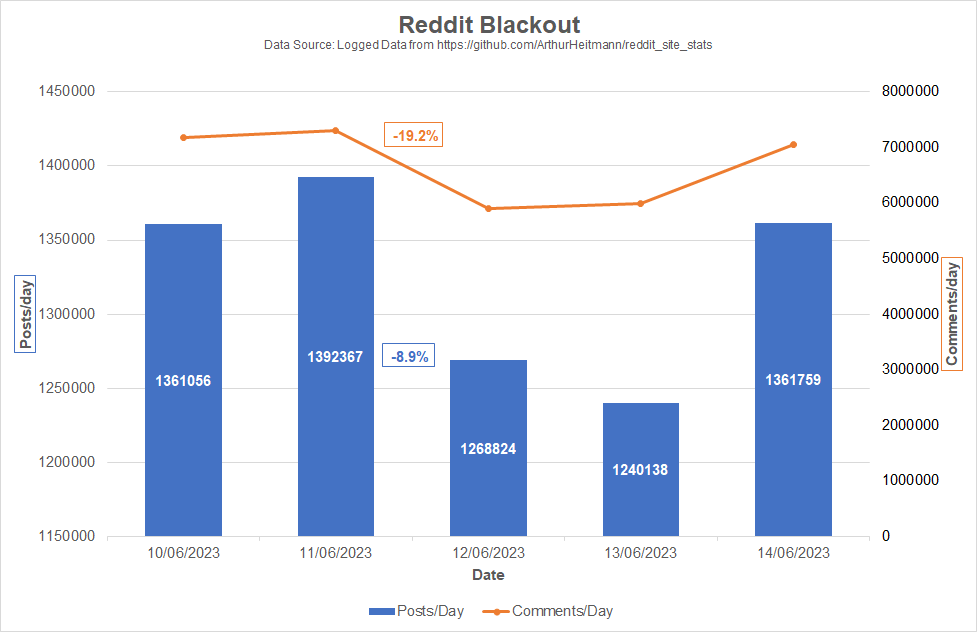
So I took the data from the blackout.photon-reddit site source.
It seems that it makes a Reddit Api call every Minute searching the newest Post and Comment and calculates both per Minute rates.
I wanted to see the effect the Blackout had over the day, so I summed the data and plotted it: Seems like between 11th and 12th June the comments/day diminished by -19.2%. The posts/day saw a decline of -8.9%
The sub with the most Activity was probably Askreddit
And how much is still dark?
HOW MANY MORE POSTS NEED TO DIE
Wow, it's really impactful presented like that