this post was submitted on 17 Jun 2023
208 points (99.5% liked)
Canada
7193 readers
374 users here now
What's going on Canada?
Communities
🍁 Meta
🗺️ Provinces / Territories
- Alberta
- British Columbia
- Manitoba
- New Brunswick
- Newfoundland and Labrador
- Northwest Territories
- Nova Scotia
- Nunavut
- Ontario
- Prince Edward Island
- Quebec
- Saskatchewan
- Yukon
🏙️ Cities / Local Communities
- Calgary (AB)
- Edmonton (AB)
- Greater Sudbury (ON)
- Halifax (NS)
- Hamilton (ON)
- Kootenays (BC)
- London (ON)
- Mississauga (ON)
- Montreal (QC)
- Nanaimo (BC)
- Oceanside (BC)
- Ottawa (ON)
- Port Alberni (BC)
- Regina (SK)
- Saskatoon (SK)
- Thunder Bay (ON)
- Toronto (ON)
- Vancouver (BC)
- Vancouver Island (BC)
- Victoria (BC)
- Waterloo (ON)
- Winnipeg (MB)
🏒 Sports
Hockey
- List of All Teams: Post on /c/hockey
- General Community: /c/Hockey
- Calgary Flames
- Edmonton Oilers
- Montréal Canadiens
- Ottawa Senators
- Toronto Maple Leafs
- Vancouver Canucks
- Winnipeg Jets
Football (NFL)
- List of All Teams:
unknown
Football (CFL)
- List of All Teams:
unknown
Baseball
- List of All Teams:
unknown - Toronto Blue Jays
Basketball
- List of All Teams:
unknown - Toronto Raptors
Soccer
- List of All Teams:
unknown - General Community: /c/CanadaSoccer
- Toronto FC
💻 Universities
💵 Finance / Shopping
- Personal Finance Canada
- BAPCSalesCanada
- Canadian Investor
- Buy Canadian
- Quebec Finance
- Churning Canada
🗣️ Politics
- Canada Politics
- General:
- By Province:
🍁 Social and Culture
Rules
Reminder that the rules for lemmy.ca also apply here. See the sidebar on the homepage:
founded 3 years ago
MODERATORS
you are viewing a single comment's thread
view the rest of the comments
view the rest of the comments


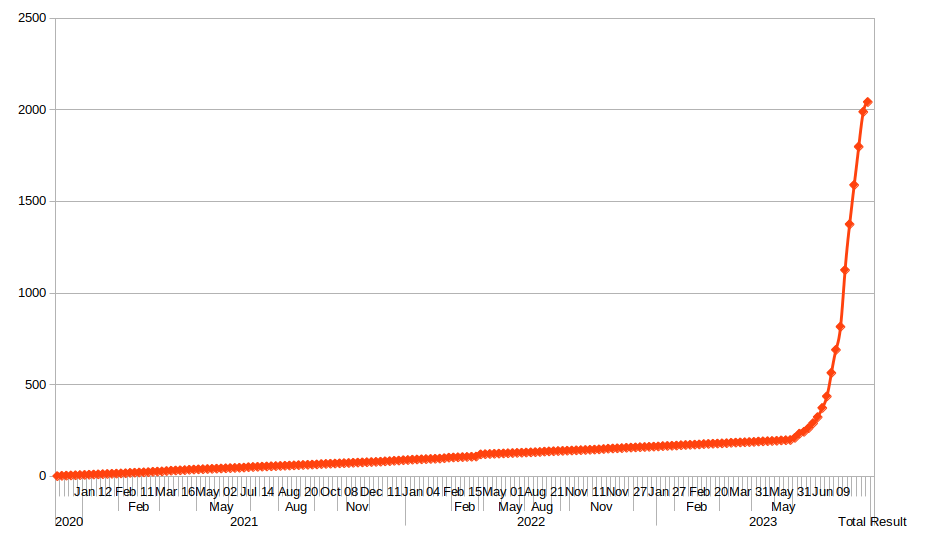
this took me way too long to do, for what it is.
Very Canadian… it’s a hockey stick graph!
Clearly Lemmy and a lack of pirates cause global warming.
Looks like the angle of the slope is flattening out, now that the initial surge is past. What're the odds you can easily reframe this as "new accounts per day" rather than total users. That would show the Reddit related spike more clearly. (First derivative, if you're a math person.)
that shouldn't be too difficult I don't think. I'll see what I can do.
Also, the graph somehow reminds me of the first wave covid cases, when we were all obsessed with watching the thing go exponential. Weird, haha.
Well I think it looks pretty good.