92
Indigenous communities overwhelmingly voted yes to Australia’s voice to parliament
(www.theguardian.com)
A place to share and discuss news relating to Australia and Australians.
[satire]Be sure to check out and subscribe to our related communities on aussie.zone:
https://aussie.zone/communities
Banner: ABC
You mention Wadeye, but the article also says this:
High indigenous population, yet lower than the overall vote for the nation. The article glosses over how many polling regions this covers.
I don't doubt that the claim is likely true. I just don't think they've done any sort of statistical analysis to actually support their claim. The article just makes a statement, then lists off numbers as if it all lines up. But there are big gaps and strong reasons to doubt the assumption, and yet the article states it as if it is fact.
The style of writing is as if they're writing an article about an academic paper, but they haven't actually got an academic paper behind it.
I think you're misunderstanding the quote (or I'm misunderstanding you). That quote is supporting the same trend indicated in Wadeye. The 31.3% refers to QLD as a whole, not the ATSI dense communities specifically.
You might be right.
I spent way too much time yesterday going through a full seat here in NSW comparing each polling location to the census data for that location, so I'm not going to do that all again for the entirety of QLD.
However, I did have a look at the QLD LGAs with the highest % ATSI populations and got the following results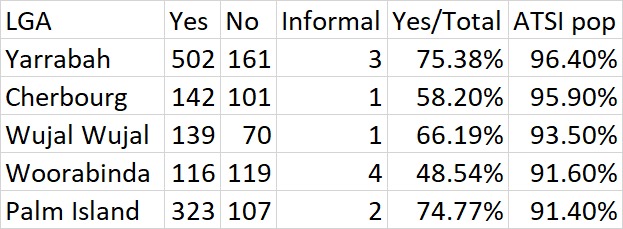
I think that'll be the closest sort of data we can get to an idea of the QLD ITAS support for the voice
Nice one! So Woorabinda is the outlier.
Were there really only a couple hundred votes in each area though?
Yeah, communities with ATSI population % that high tend to be pretty small after all, so polling places in those communities aren't going to have a massive number of votes.
All the results for each polling centre can be found . The places I used as an example were across several different